
Dubai · every registered sale · to 5 Nov 2026

Know Dubai property as well as your agent does.

136,911 sales this year, read every morning. What sold, what is new, what is hot, what your budget buys, and whether to buy or sell now.

34,000
sales, last 90 days
AED 1,697
per sq ft, apartments
63%
off-plan
James Paul Booth
The agent's view this week
“Sales rose 4.8% this week, but one week is noise: over 90 days they are down only 10.9%, at 34,000 sales. Prices per square foot are flat over the same 90 days. The off-plan share fell from 71% to 63%, so the slowdown is in launches, not in ready homes. If I were buying now, I would start where prices have come off: Liwan (-18%), Palm Deira (-17%), Sama Al Jadaf (-13%). If I were selling, I would price to the last 90 days of sales, not to the asking prices around me.”
James Paul Booth, Dubai Real Estate Analyst since 2007. A personal view from the figures on this page. Not financial advice.
Where is the action?

Dubai sales heat map

Map of Dubai: price per sq ft change on last year, by community

Every community on one map: sales value, number of sales, price change on last year, homes for sale, sold against asking and resales at a loss.

Green = prices up on last year · red = down. Filter by type, off-plan or ready, and bedrooms.

Hot spots · Market quadrant · Sales tracker

Full answer →
What's new

Biggest new projects

  1. Qpoint Liwan-Plot R062 Liwan · 169 sales · AED 900k
  2. Bay Estate Palm Deira · 114 sales · AED 7.47m
  3. Portside Square Madinat Dubai Almelaheyah · 112 sales · AED 2.64m

News roundup · This month · This quarter

Full answer →
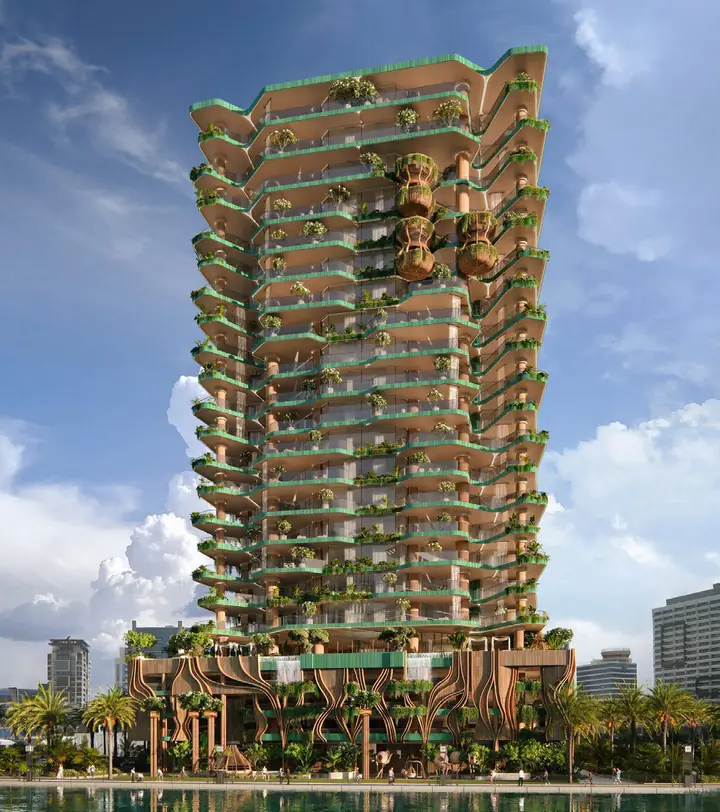
EYWA tower on the Dubai Water Canal, artist's impression
November Tower Update

EYWA, Business Bay

52 homes on the Dubai Water Canal by R.Evolution. 64.2% complete at the 17 September 2026 DLD inspection. Show residence films, a 3D model of the tower and a walk through Residence 203.

Open the EYWA microsite →

What's going on in Dubai

DLD record to 5 Nov 2026

Every registered sale, every week of 2026. Yellow is off-plan, black is resale. Roll over a bar for the week.

01,0002,0003,0004,0005,000Week to 2026-01-01: 5 sales, 5 off-plan, 0 resaleWeek to 2026-01-08: 3,539 sales, 2,344 off-plan, 1,195 resaleWeek to 2026-01-15: 4,116 sales, 2,696 off-plan, 1,420 resaleWeek to 2026-01-22: 4,334 sales, 2,801 off-plan, 1,533 resaleWeek to 2026-01-29: 4,444 sales, 2,813 off-plan, 1,631 resaleWeek to 2026-02-05: 4,209 sales, 2,738 off-plan, 1,471 resaleWeek to 2026-02-12: 4,640 sales, 2,920 off-plan, 1,720 resaleWeek to 2026-02-19: 3,966 sales, 2,387 off-plan, 1,579 resaleWeek to 2026-02-26: 4,031 sales, 2,423 off-plan, 1,608 resaleWeek to 2026-03-05: 2,782 sales, 1,872 off-plan, 910 resaleWeek to 2026-03-12: 3,587 sales, 2,259 off-plan, 1,328 resaleWeek to 2026-03-19: 2,973 sales, 2,066 off-plan, 907 resaleWeek to 2026-03-26: 2,851 sales, 2,163 off-plan, 688 resaleWeek to 2026-04-02: 3,634 sales, 2,798 off-plan, 836 resaleWeek to 2026-04-09: 3,458 sales, 2,557 off-plan, 901 resaleWeek to 2026-04-16: 3,177 sales, 2,423 off-plan, 754 resaleWeek to 2026-04-23: 3,016 sales, 2,173 off-plan, 843 resaleWeek to 2026-04-30: 2,865 sales, 2,003 off-plan, 862 resaleWeek to 2026-05-07: 2,416 sales, 1,674 off-plan, 742 resaleWeek to 2026-05-14: 3,143 sales, 2,316 off-plan, 827 resaleWeek to 2026-05-21: 3,492 sales, 2,502 off-plan, 990 resaleWeek to 2026-05-28: 1,139 sales, 891 off-plan, 248 resaleWeek to 2026-06-04: 2,638 sales, 2,080 off-plan, 558 resaleWeek to 2026-06-11: 3,157 sales, 2,344 off-plan, 813 resaleWeek to 2026-06-18: 3,090 sales, 2,170 off-plan, 920 resaleWeek to 2026-06-25: 3,142 sales, 2,233 off-plan, 909 resaleWeek to 2026-07-02: 3,021 sales, 2,021 off-plan, 1,000 resaleWeek to 2026-07-09: 2,753 sales, 1,868 off-plan, 885 resaleWeek to 2026-07-16: 3,197 sales, 2,362 off-plan, 835 resaleWeek to 2026-07-23: 2,891 sales, 1,976 off-plan, 915 resaleWeek to 2026-07-30: 3,444 sales, 2,347 off-plan, 1,097 resaleWeek to 2026-08-06: 3,252 sales, 2,330 off-plan, 922 resaleWeek to 2026-08-13: 2,827 sales, 1,960 off-plan, 867 resaleWeek to 2026-08-20: 3,094 sales, 2,147 off-plan, 947 resaleWeek to 2026-08-27: 2,695 sales, 1,652 off-plan, 1,043 resaleWeek to 2026-09-03: 2,294 sales, 1,525 off-plan, 769 resaleWeek to 2026-09-10: 2,901 sales, 1,954 off-plan, 947 resaleWeek to 2026-09-17: 2,480 sales, 1,639 off-plan, 841 resaleWeek to 2026-09-24: 2,379 sales, 1,481 off-plan, 898 resaleWeek to 2026-10-01: 2,365 sales, 1,472 off-plan, 893 resaleWeek to 2026-10-08: 3,151 sales, 1,617 off-plan, 1,534 resaleWeek to 2026-10-15: 2,653 sales, 1,733 off-plan, 920 resaleWeek to 2026-10-22: 2,488 sales, 1,558 off-plan, 930 resaleWeek to 2026-10-29: 2,530 sales, 1,419 off-plan, 1,111 resaleWeek to 2026-11-05: 2,652 sales, 1,503 off-plan, 1,149 resaleJanFebMarAprMayJunJulAugSepOctNov
Off-planResale

Last 90 days

Sales34,000▼ 10.9%
ValueAED 91.3bn▼ 2.3%
Off-plan share63%71% before
Median apartment, per sq ftAED 1,697▼ 0.1%

Change is against the 90 days before. The record starts 1 January 2026, so there is no year-on-year yet.

Sales rising fastest

AreaSales, 90 daysvs 90 days before
Al Hebiah First655▲ 285.0%
Dubai Creek Harbour539▲ 166.0%
Sama Al Jadaf337▲ 64.0%
Dubai Industrial City253▲ 58.0%
International City Ph 1393▲ 33.0%

Sales falling fastest

AreaSales, 90 daysvs before
Dubai South2,749▼ 55.0%
Al Furjan363▼ 46.0%
Down Town Jabal Ali663▼ 39.0%
International City Ph 2 & 3330▼ 37.0%
Palm Deira396▼ 35.0%

What's new

Projects with a first sale in the last 60 days

New projects, by sales so far

ProjectFirst saleSalesTypical priceStatus
Qpoint Liwan-Plot R062
Liwan
29 Oct169AED 900kReady
Bay Estate
Palm Deira
22 Oct114AED 7.47mReady
Portside Square
Madinat Dubai Almelaheyah
23 Oct112AED 2.64mOff-plan
Avenue Park Towers Ii
Al Kifaf
25 Sep92AED 2.88mOff-plan
Portside By Samana Developers
Down Town Jabal Ali
22 Sep85AED 1.17mOff-plan
The Wow Tower
Dubai Land Residence Complex
15 Oct51AED 783kOff-plan
Greenfield 2 By Samana Developers
International City Ph 2 & 3
30 Sep42AED 966kOff-plan
Sunrise Valley
Nad Al Sheba
4 Nov30AED 5.07mReady

Typical price is the median of all registered sales in the project.

New on BUY DUBAI

All 5,009 live towers

Updates

News roundupSales by weekSales by monthNew launches

Latest videos, checked against the record

Dubai property YouTube
Checked 15 Oct

Dubai Finance: “The 5 best places in Dubai to buy a property right now!”

Most numbers hold up. Two claims about JVC and JLT do not, and the price fall is off-plan mix: ready homes are flat.

The video saysThe sales record saysVerdict
Downtown: 3,134 sales a year, median AED 2.9m2,914 sales, median AED 2.98m✓ holds
Creek Harbour: AED 2,457/sq ft, 64% off-planAED 2,560/sq ft, 67% off-plan✓ holds
Dubai Hills: AED 2,411/sq ftAED 2,401/sq ft✓ holds
JVC has the most sales of any locationJVC 12,047; Dubai South is busier at 16,213✗ wrong
JLT median price AED 1.68m, 63% ready homesAED 1.51m, 49% ready homes✗ wrong
Apartment prices down 7 months in a row, -3.3% a yearDown 4.0% a year in Sep, but not 7 straight falls; ready homes +1.2%~ partly
The weekly Roundup

Week 44: law, prices, launches, press and video

The top Dubai property videos of the week, each one summed up, with the news and the launches.

Read the Roundup

What's hot

Dubai communities, scored out of 100

Six tests, each scored 0–100: sales growth, launches, handovers, renter demand, resident happiness and yield. The hot score mixes all six.

#CommunityHotSalesLaunchesHandoversRentersHappinessYield
1Jumeirah Village Circle
75739497585871
2Dubai Islands
6959966821100–
3City of Arabia
6890645439–94
4Nad Al Sheba
68818683597422
5Dubai Land Residence Complex
67609580334292
6Dubai South (Dubai World Central)
657210063595345
7Arjan
64686089643075
8Dubai Hills Estate
64593694629143
9Dubai Creek Harbour (The Lagoons)
62556888518131
10Majan
61737252314790
11Al Furjan
60446478595661
12Dubai Production City (IMPZ)
60607855644100
RealEstateRanking for NovemberBest 1-beds to buy nowHighest yieldLowest risk

What can I buy with…

Registered sales, last 6 months

Type a budget. You see the areas where homes of that size typically sold at or under it, with the entry price (the cheapest quarter of sales).

Apartments only. Typical = median of registered sales. Off-plan prices are developer prices before handover.

Should I buy?

Signals from the sales record, not advice

Where buyers have the edge

Price down on the last 90 days, with at least 150 sales.

AreaAED/sq ftPrice change
Liwan1,000▼ 18.0%
Palm Deira2,460▼ 16.8%
Sama Al Jadaf1,957▼ 13.1%
Palm Jumeirah2,936▼ 10.8%
Meydan One1,968▼ 7.7%
Al Furjan1,346▼ 7.4%
Al Hebiah First1,709▼ 6.9%

Should I sell?

What homes like yours sold for, last 6 months

Value my home

Pick the tower and bedrooms. The estimate shows here at once, from the tower's registered sales.

Get the full report on WhatsApp

The sales of units like yours, the asking prices against them and a price range.

Time to sell and when to sell →

Dalia AI

What you wish you could tell your real estate agent

Say it to Dalia instead. She has no listing to push and earns no commission. She replies on WhatsApp with the sales that matter, and a licensed person takes it from there when you want.

Every tower, priced from what sold

5,009 building pages in 27 communities · more every morning

The other emirates

Totals from each land department

Agents who closed the most

Published sales, matched to the DLD register

Pages, guides and data

Everything on BUY DUBAI
Sources
  1. Abu Dhabi → — Source: ADREC via DARI
  2. Ajman → — Source: Ajman DLRR
  3. Sharjah → — Source: Sharjah SRERD
  4. Ras Al Khaimah → — Source: RAK Municipality
DaliaAIAsk DaliaAI analyst

Rental data (signed rents, renewals, asking against signed): RENT DUBAI, our sister site for tenants, from Dubai Land Department Ejari leases.